Apostle is all about your users. They inspire, produce and share content throughout all the platforms. Therefore it's important that you stay updated on their performance too. We understand the importance of monitoring the overall and grouped performance of your team. Therefore, we carefully gather all the small details and use them to calculate detailed statistics and provide you with a clear overview of your results.
Table of contents
- Selecting and exporting;
- Understanding the insight graph;
- Analyze and interpret the numbers;
- Individual user insights;
- Pages insights;
- Linktracking with Bitly.
Selecting and exporting
To access your team’s analytics, click in Insights on your desktop’s dashboard.
On the top of the page, you’ll see this section shown below. This is where you’ll provide details to Apostle on which insights you want to access.
- Select Date Range: This is where you’ll need to enter time interval of data you want to access.
- Select Group: You can select and view insights for specific groups and see how they are performing. These are the same groups that you created for your team and categorized your users in.
- Select Subjects: You can also view specific insights for subjects you’ve created earlier. This will allow you to access analytics of each individual subject and post more briefly.
- Chat interval: This option will categorize your graph data. You need to select the interval(daily, weekly, monthly or quarterly stats) for the graph.
Export options
On the left side, you’ll see report export options. These options allow you to share your insights with your management team, without them creating an account.
- Export to Excel: Clicking this option will automatically create and download an excel file for the date range, group, subject and interval you’ve selected. These analytics can be opened in excel for offline use or presentations.
- Copy share link: Clicking this button will automatically copy a share link to your clipboard which can be shared with non-Apostle colleagues and users too. After opening the share link, your colleagues or management can easily click through all the results without them having access to the entire platform.
Understanding the Insight graph
The graph is the visual representation of your basic insights e.g. shared, uploaded and suggested posts. There are two modes to see the graph, either in Wide or Compact mode.
*The graph shown below is in Wide mode. You can switch between display modes from upper left corner buttons.
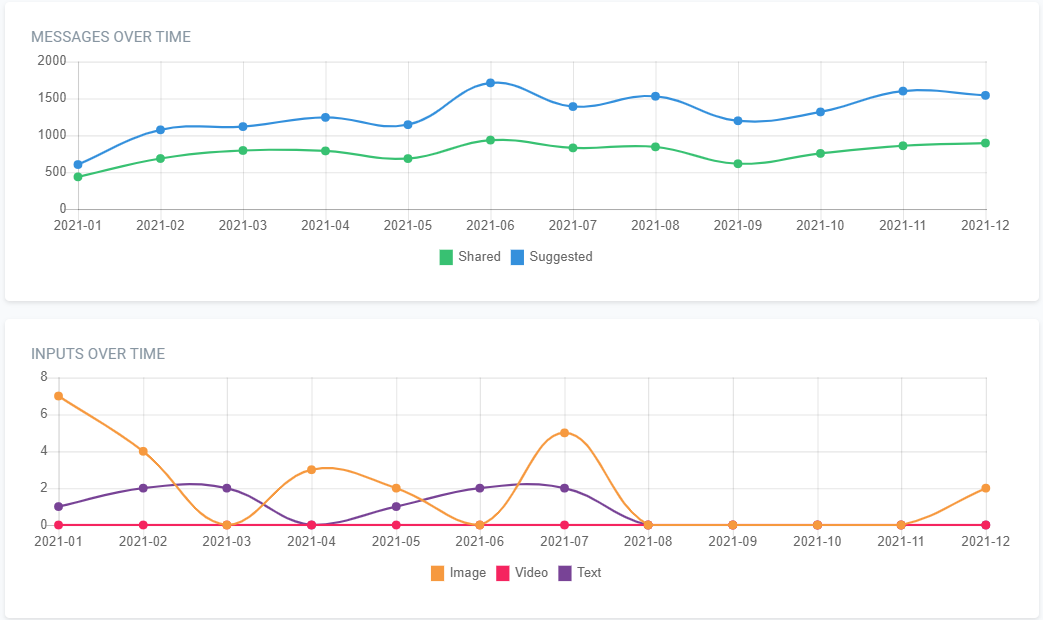
The first graph displays two curves. The blue curve shows total messages/posts suggested by the Social Master to the users, while the green curve shows the number of posts that were actually shared.
The second graph shows the total amount of uploads by your users in the given time range. The orange curve shows the images, pink for videos and purple for text-only uploads. The inputs are measured by the number of uploads by your team through our mobile app.
Analyze and interpret the numbers
Below the graphs you'll find some more detailed insights on how your team is performing. These are the most important metrics that we have already selected for you. Let’s take a closer look at what each of these metrics mean.
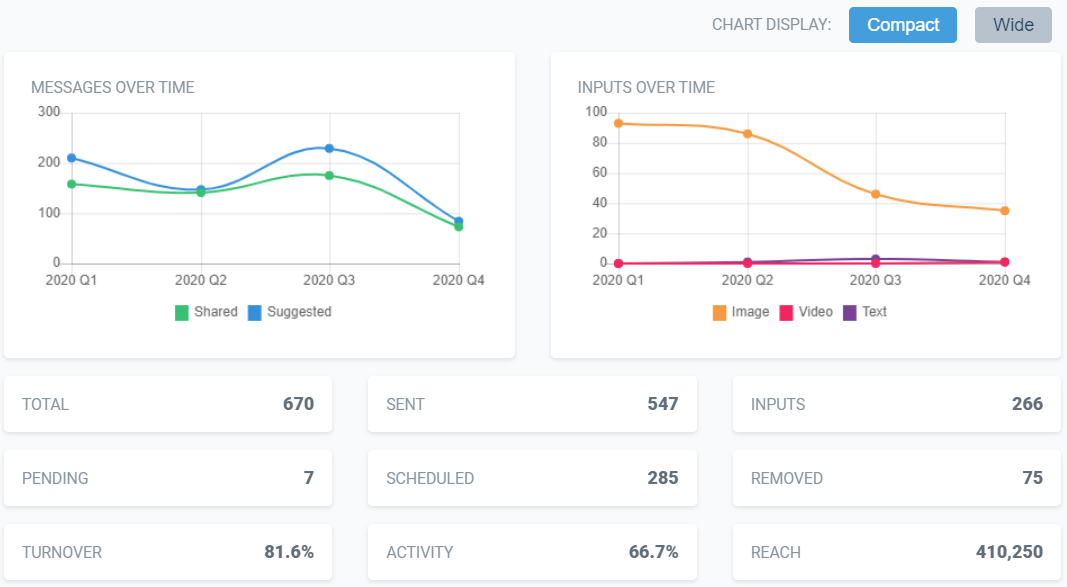
- Total: This shows the total amount of suggested posts for all the pages and ambassadors.
- Sent: The amount of posts actually sent by users out of the total posts.
- Inputs: The amount of posts uploaded to dashboard via our mobile app.
- Pending: Amount of posts in queue, waiting to be sent by ambassadors/users.
- Scheduled: The number of posts currently scheduled for all the corporate pages and ambassadors.
- Removed: The total number of posts deleted by the users.
- Turnover: The percentage of posts actually sent out of total posts. This is calculated by (sent posts*100)/Total posts.
- Activity: This is the percentage of active users that have logged in, shared or uploaded something in the given time range.
- Reach: This is an estimation of total reach of sent posts. This is estimated by a simple formula (Amount of sent posts x 750 (average number of connections people have on social media).
These are the basic stats to give you a rough idea of the direction your team(or specific group) is headed. In addition, it shows how a subject or specific group has performed over time. However, you'll need more details to plan and structure your next strategy. Don't worry, we got you covered! We provide detailed individual statistics of users and pages for your analysis. Instantly check which type of content is performing well and get a clear view of your top performing ambassadors. We'll discuss this in the next chapter.
Individual User Insights
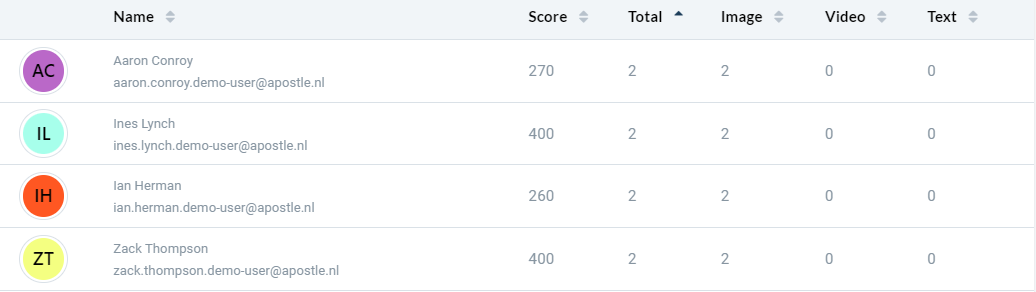
Quick basic insights of users are displayed in the table below. The Activity table shows the user’s score and other stats e.g pending, removed, sent and total posts. All the stats are similar to the ones mentioned before except the individual scores. Individual scores are measured by posts shared and uploaded(10 points per share and 20 points per upload).

Switch to the Input table to see individual stats of your users. The total amount of uploads per individual user, split up by different media type.
The Channel page is purposed to show the metrics of ambassadors split up by the different platforms they've shared to. Here you'll find the number of posts your ambassadors have shared through the Apostle platform. In addition, you'll find the number of Likes, Shares and Comments for LinkedIn only*.
Dive deeper
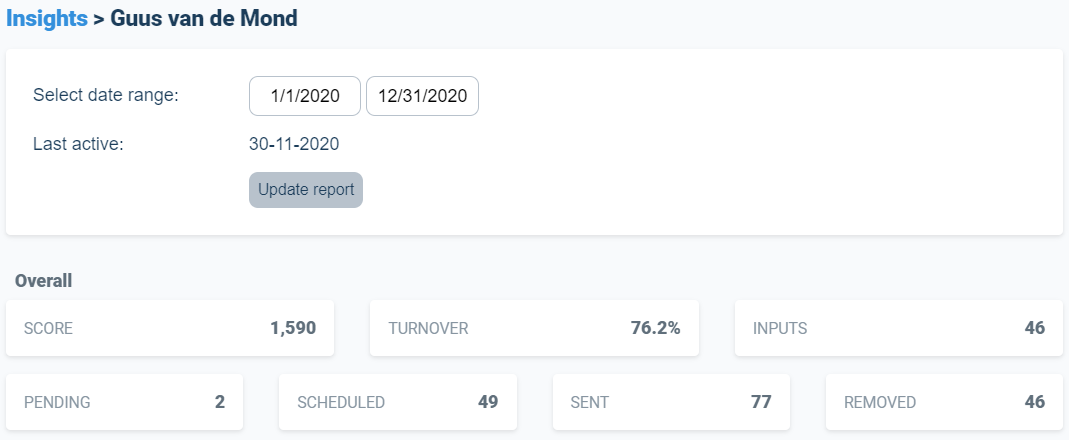
Diving deeper into individual statistics, you can see detailed analytics for each user by simply clicking on their name. It shows brief details, pie charts and other analytics for that specific user.
- You can select the time range for this user and see his overall stats(Score, turnover, inputs, scheduled, sent) here.
-
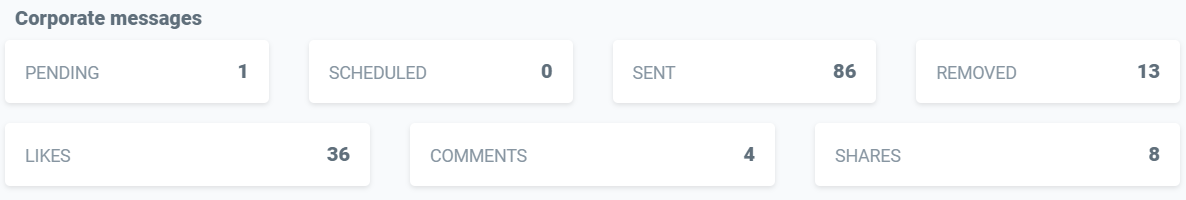
This section of Corporate messages shows the amount of corporate pages post this specific user has shared.
-
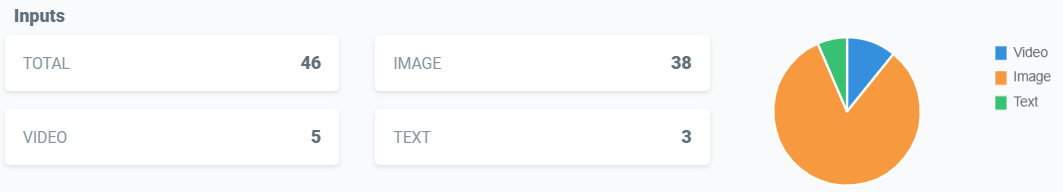
The input section contains metrics of the upload through the mobile app. The number of total posts created and the number of specific media files used. You’ll also see a pie chart of media type upload for this user.
-
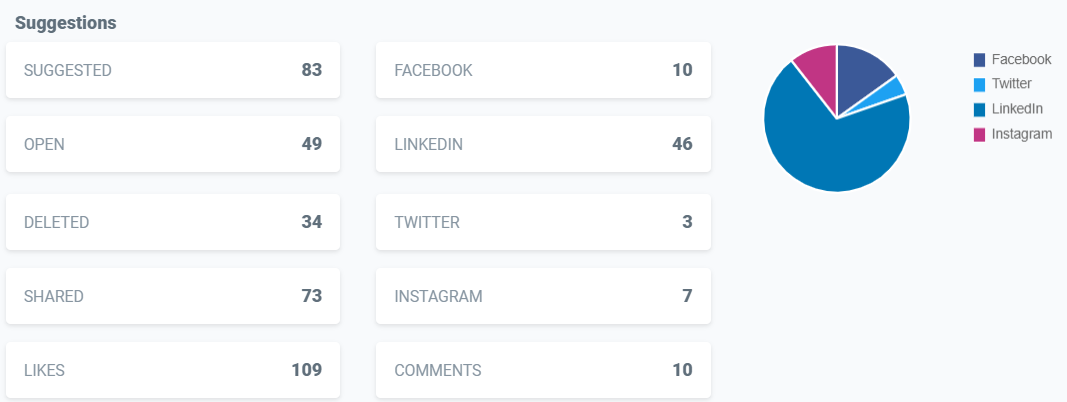
The Suggestions view shows useful some insights on the sharing behaviour of this specific user. Basically you'll find the same stats as the general overview, but now on an individual level.
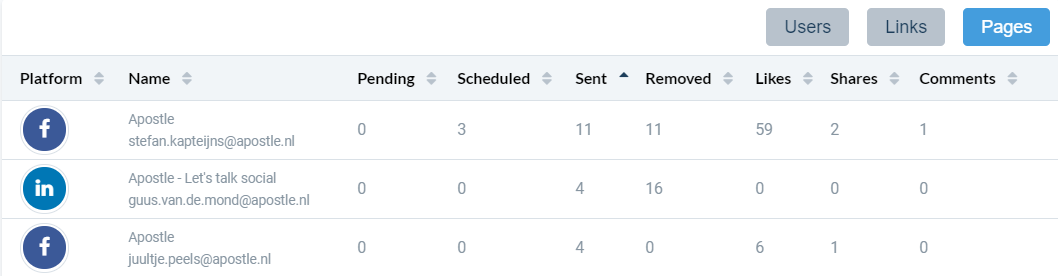
Page Insights
You can access the page insights by switching to Pages instead of Users in the general Insights overview. These insights are similar to the individual insights. These metrics are specifically interesting for users who are only using corporate pages in Apostle. Page stats show pending posts, scheduled posts and actually sent posts with basic engagement details on these pages e.g comments, likes and shares.
Linktracking with Bitly
Apostle works with a Bitly integration to track links that are created in the platform. Each link will be automatically transformed to a bitly link to track results in the Insights. The results are shown in the Links page of the general Insights overview.
- To activate the link tracking, simply copy and paste your url in the composer while scheduling content for your ambassadors. Apostle will automatically create a bitly link of every link you use in the composer.

Insights are a great way to monitor individual performances, take better and specific actions and increase your productivity. This is one of the most important things in effective team management. Use them to your advantage!